
Navigating West Coast Heavy Haul Bottlenecks
Freedom Heavy Haul can offer expedited Pickup and Delivery for any size shipment anywhere in the USA. Contact us today for No Hassle, No Pressure Pricing.
Ports and their nearby arterials are the first and last mile of the supply chain. A tentative ILWU-PMA labor deal on February 20 has moved queues, but clearing will take months. That pause collides with spring peak and Chinese New Year arrivals, raising variability for truckers and shippers.
DAT data shows los angeles outbound load-to-truck ratios leapt from 0.3 to 2.2 in a week, then sat near 1.7 into March. During the slowdown, Los Angeles flipped from a headhaul to a near dead-end, forcing long deadheads to Phoenix and Las Vegas.
Global Port Tracker forecasts a 17% year-over-year jump in U.S. containerized imports in March as retailers rebuild inventories. That surge sends ripples from long beach across regional linehaul lanes and local drayage capacity.
This report will map pressure points at major terminals, labor friction, rail delays behind gates, shifting flows to the East Coast, and data-led steps carriers can use. Watch yard turn times, appointment compliance, and gate hour use to cut dwell and protect capacity in real time.
Present-day pressure points at Los Angeles, Long Beach, and Oakland
MarineTraffic and Vizion metrics highlight rising anchor queues and slower clearance at major terminals. Average TEUs off port limits climbed to 51,228 at los angeles long beach and 35,153 at port oakland, totaling about 86,381 TEUs. That offshore build equals roughly $5.2 billion in cargo at stake.
Los Angeles–Long Beach: headhaul volatility and spot market swings
Rapid shifts in los angeles outbound load-to-truck ratios—from 0.3 to 2.2 in a week—show how los angeles long spot markets can rebalance lanes almost overnight. When ratios spike, pricing and routing reset, turning slow lanes into premium local runs in days.
Oakland snapshot: berths, lashers, and terminal slow-and-go impacts
Port oakland’s offshore TEUs and a seven-day clearance near 58% mean fewer effective berths and more dwell variability. Lashers delays and labor friction create short, intense bursts of yard congestion that ripple into longer dwell for containers.
Load-to-truck ratio whiplash and what it signals for trucks and containers
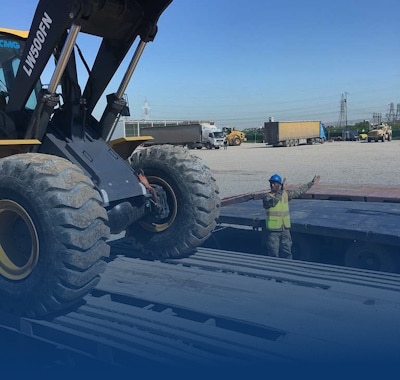
When ratios surge, drivers chase high-paying regional loads and low-margin drays face longer waits and more days to secure moves. Photos from Fenix show on-terminal queues spilling into city corridors, raising truck turns and dispatcher complexity.
- Watch: anchor queue size, seven-day clearance, and daily turn attempts at Fenix and adjacent terminals.
- Near-term outlook: as more ships berth, gate queues may lengthen unless extended hours and yard stacking improve throughput.
Labor friction and terminal productivity: how union dynamics reshape capacity
Job-order gaps and withheld lashers in June tightened moves per hour at major terminals. The PMA reported that from June 2–7 ILWU crews at Los Angeles and Long Beach refused to dispatch lashers, leaving ships idle and exports stranded.
ILWU-PMA flashpoints: withheld lashers, unfilled job orders, and ship idle time
Numbers matter: 260 of 900 job orders went unfilled and 559 registered workers who came to dispatch were denied work opportunities. That translates to fewer gangs on deck and slower shift productivity at ports los nodes.
“Operations generally improved later in LA, Long Beach, and Oakland, but slowdowns persisted in Seattle and Tacoma.”
Containers waiting off port limits: MarineTraffic and Vizion data trends
MarineTraffic showed a marked surge in containers waiting off LA/LB and Oakland. Vizion reported seven-day clearance rates of 62% at Los Angeles and 64% at Long Beach, signaling stretched yard turns.
- Direct effect: withheld lashers and unfilled orders cut terminal moves per hour, stretching time at berth and clogging stacks.
- Capacity chain reaction: when ships sit, berths lock up and containers pile, creating unpredictable truck waves for local dispatch.
- Risk management: with only a tentative labor agreement framework, planners should scenario-plan for short-notice slowdowns.
- Tip for carriers: build flexible slotting and buffer time into dispatch to limit missed turns and detention.
Data signals to watch now: demand, dwell, and rate momentum
Monitor short-term signals: DAT‘s load-to-truck swings often flag imminent rate changes. Small moves on those boards can show when local pricing will tighten, giving carriers and shippers time to respond.
The recent run-up in los angeles outbound ratios—from 0.3 to 2.2 in a week and holding near 1.7 through March—follows earlier peaks near 6.7. Combine that with Global Port Tracker’s near 17% import rise year-over-year and you get clear pressure on yard and dray capacity.
From backlog to throughput: DAT ratios, volume surges, and seasonal overlap
Clearing stacked vessels can create a 25–41 day lag as containers move from ship to warehouse to truck. That lag often overlaps with California and Southeast reefer season, multiplying demand for chassis and refrigerated capacity.
- Track ratios: load-to-truck is an early indicator of rate momentum.
- Watch volume spikes: seasonal surges strain limited dray and yard resources at key ports.
- Translate data into dispatch: prioritize reliable appointment slots and avoid peak gate windows when days-to-pick rise.
- Use telemetry: DAT boards, terminal turn dashboards, and yard cams to redeploy drivers away from low-yield turns.
“Expect spot relief to lag throughput gains by a week or two as containers exit stacks and chassis cycles normalize.”
Map the 25–41 day lag across your supply chain and pre-book capacity for critical lanes. Small operational wins—earlier gate entries, split chassis staging, and live prompts—shave minutes off each turn and keep freight moving.
Rail bottlenecks behind the gates: when on-dock rails meet limited cars
Railcar shortages are forcing boxes to sit longer on terminal rails, raising stack times and tying up chassis. At ports los angeles the rail-bound dwell averages 7.5 days; at long beach it is just over 8 days. About 60% of long-dwelling containers are slated for rail.
Land capacity sits near 90%, well above the efficient 70–75% range. Once yards cross 75% capacity, moves slow, queues lengthen, and truck idle time rises. That dynamic increases local congestion and reduces weekly turns.
Pacific Northwest pinch points and inland routing choices
Seattle shows import dwell above 16 days and Tacoma about 8 days. Ocean carriers that concentrate routing on single inland ramps can worsen localized pileups. More diversified ramps spread load but keep boxes inland longer.
- Why it matters: on-dock rail limits raise stack time and tie up chassis that dray fleets and the local truck market need to cycle.
- Realistic outlook: BNSF’s extra locomotives, Chicago turns, and 3,000 hires should improve velocity gradually, not instantly.
“Limited railcar availability can lead to stacking that blocks new imports and increases vessel dwell.”
Practical steps: pre-stage tractors, time ETAs to post-rail release windows, and keep tight comms with terminals to catch short surges. These moves ease pressure at key west coast ports and other major ports.
Shifting cargo to East Coast ports and the Panama Canal cost equation
More shippers are steering cargo toward east coast terminals to lock in berth time and rail options. Xeneta data showed container spot rates jumped about 15% in early June as multiple disruptions, including low-water limits at the Panama Canal, squeezed capacity.
Rerouting trade-offs: canal fees, draft limits, and added transit days
Canal transits now carry draft and weight limits plus per-container surcharges. For example, Hapag-Lloyd has cited roughly $260 per box, while CMA CGM listed about $300. These fees alter the math for diversions.
Direct reroutes to Houston can add 12–18 days to door-to-door time, but they can stabilize ETA risk. NY/NJ imports climbed 11.5% Jan–May, with an estimated 6.5% shift from los angeles and long beach.
- Why pivot: perceived reliability, open berth windows, and strong rail links to inland markets.
- Canal math: draft caps can force longer routes around South America if weights exceed thresholds.
- Time vs cost: extra days may raise landed cost and detention risk even as schedule certainty improves.
Ports like Savannah and Norfolk are taking ad hoc calls. Savannah expects about 155 July vessel calls with many unplanned and around 10 days at anchorage. Norfolk has used on-dock rail to move boxes inland and even back west when needed.
“A serious work stoppage at LA/LB would ripple into pricing and inventory strategies.”
Quick checklist: confirm ocean carriers’ diversion rules, pre-book inland rail slots, and set clear thresholds for waiting offshore versus diverting. Mix allocations across east coast ports and your original west coast port plan to balance risk and cost.
West Coast heavy haul bottlenecks through port-adjacent roads: what’s next for shippers and carriers
Expect lingering variability at terminals as rail-bound dwell near los angeles runs about 7.5 days and long beach edges a little over 8 days. Land capacity sits around 90%, well above the efficient 70–75% range.
Use appointment windows, sequence pickups by grounded status, and pre-assign truck power to boxes likeliest to release in hours. Tighten SOPs on chassis swaps, pre-clear customs, and benchmark days-in-yard to catch rising dwell fast.
Blend allocations across los angeles, long beach, and select alternate ports while watching Vizion and DAT clearance numbers. Model labor agreement shocks, keep contingency carriers warm, and set triggers to pivot cargo to rail or other gateways.
By marrying live data with disciplined operations, freight teams can protect margins, limit detention, and move the most valuable cargo first.
FAQ
Q: What are the main pressure points at Los Angeles, Long Beach, and Oakland today?
A: Ports such as Los Angeles, Long Beach, and Oakland face congestion from high container volumes, limited gate hours, and yard space constraints. Truck patterns and rail car availability also strain throughput. Recent swings in import demand and intermittent terminal productivity slow cargo flow and increase dwell times for containers both on and off terminals.
Q: How do headhaul volatility and spot market swings affect trucking and container availability?
A: Fluctuating headhaul demand drives sharp changes in spot rates and load-to-truck ratios. When import volumes spike, carriers see lower backhaul demand, which raises empty miles and tightens access to chassis and trucks. That leads to quicker rate spikes and fewer available drivers for quick turn pickups.
Q: What does the Oakland situation look like for berths and terminal operations?
A: Oakland terminals have faced berth congestion, slower vessel moves, and intermittent use of lashers. These factors reduce crane productivity and increase ship idle time, which cascades into longer waiting lists for berth windows and yard backups.
Q: What is load-to-truck ratio whiplash and why should shippers care?
A: Load-to-truck ratio whiplash means rapid swings in the number of loads per available truck. High ratios signal tight drayage capacity, higher short-term rates, and longer appointment waits. Shippers see unpredictable pickup windows and higher costs when ratios spike suddenly.
Q: How are ILWU and PMA labor dynamics affecting terminal capacity?
A: Union-management tensions can slow hiring, delay lashers, and leave job orders unfilled. That reduces terminal productivity and can extend container dwell and vessel idle times. Even short disputes or slowdowns ripple into longer port processing timelines.
Q: Are there measurable trends showing containers waiting off port limits?
A: Yes. Data from MarineTraffic and supply-chain analytics show increased anchorage counts and more containers queued outside terminals. These tools track vessel positions and waiting times, highlighting persistent off-port stacks during peak weeks.
Q: Which data signals should carriers and shippers watch closely now?
A: Key metrics include DAT load-to-truck ratios, terminal dwell days, vessel queue lengths, and import volume surges. Watching these in near real time helps predict rate momentum, appointment availability, and whether seasonal overlap will stress capacity further.
Q: How do rail bottlenecks behind the gates worsen port congestion?
A: When on-dock rail meets limited rail cars, containers meant for inland moves back up on terminal yards. This consumes valuable land space, slows gate moves, and pushes more boxes into off-dock storage, increasing trucking demand and costs.
Q: What are typical rail-related dwell times in the LA/Long Beach complex?
A: Rail-bound containers can experience dwell times in the 7.5–8+ day range during peak periods. Extended waits reflect chassis shortages, limited rail slot availability, and constrained marshalling yards, all of which squeeze terminal throughput.
Q: Where are pinch points in the Pacific Northwest and how do they affect routing?
A: Seattle and Tacoma face berth congestion and inland rail bottlenecks, which force shippers to choose longer transload or dray routes. These choices can add time and cost, prompting some to reroute to alternative gateways when capacity is tight.
Q: What are the trade-offs when rerouting cargo to East Coast ports via the Panama Canal?
A: Rerouting adds canal fees, longer sailing distances, and potential draft or size limits for certain vessels. Transit to ports like Houston can add roughly 12–18 days versus a direct call, but it can be worthwhile when West gateways are severely congested and warehousing or inventory timing justify the delay.
Q: How do canal costs compare with delays and demurrage at Pacific ports?
A: Shippers must weigh Panama Canal tolls and longer ocean transit against daily demurrage, detention, and dwell penalties at Pacific terminals. When port congestion causes multi-day holds, the total landed-cost difference can make canal routing financially sensible despite higher ocean spend.
Q: What can shippers and carriers do now to mitigate nearby port road congestion impacts?
A: Improving appointment scheduling, using off-peak pickup windows, pre-booking chassis and rail slots, and leveraging near-port storage reduce truck dwell. Collaboration with ocean carriers, 3PLs, and terminals for visibility and contingency routing helps smooth flows during local roadway strain.
Q: How should supply chain managers use data to make routing and mode decisions?
A: Combine vessel position and dwell metrics with load-to-truck ratios and rail availability to forecast transit reliability. Scenario-modeling costs—including canal fees, inland transit, and dwell-related charges—lets managers choose the best gateway or mode for time-sensitive cargo.