Northern Corn Belt Freight: Weather, Crops & Road Limits
Freedom Heavy Haul can offer expedited Pickup and Delivery for any size shipment anywhere in the USA. Contact us today for No Hassle, No Pressure Pricing.
Welcome to our deep dive into how shifting climate patterns shape America’s agricultural heartland. Here, massive volumes of grain travel through a carefully coordinated network of trucks, trains, and barges. But this system faces growing pressure from unpredictable conditions that ripple far beyond farm fields.
The U.S. produces roughly one-third of the world’s corn and soybeans—staples that fuel global food supplies. Moving these crops demands reliable infrastructure, yet extreme events like floods or ice storms can halt operations for days. Recent data shows these disruptions now occur 25% more often than two decades ago.
Why does this matter? Delays cascade through supply chains, affecting prices at grocery stores and earnings for families working the land. A single flooded highway or frozen rail line can bottleneck deliveries, creating shortages thousands of miles away.
This article breaks down the invisible links between harvests, transportation, and your dinner table. You’ll see how climate shifts strain every step of the journey—from planting schedules to trucking routes. We’ll also explore practical solutions helping farmers and transporters adapt.
By the end, you’ll grasp why protecting this fragile network matters for both local economies and worldwide food security. Let’s uncover how rain, heat, and policy decisions shape what grows—and how it reaches us.
Understanding the Northern Corn Belt Freight: Weather, Crops, and Road Limits
Moving America’s harvest from field to port requires precision timing. States like Illinois and Iowa form a vital agricultural zone, where seasonal rhythms dictate transportation needs. This area ships over half of U.S. grain exports through interconnected systems.
Critical Infrastructure Pressures
Peak harvest seasons strain aging infrastructure. Thousands of grain elevators must coordinate with truckers, rail operators, and barge companies simultaneously. Consider these common hurdles:
- Port congestion during autumn shipments
- Weight restrictions on rural bridges
- Limited nighttime barge operations
Multimodal Network Synergy
The Mississippi River remains the backbone of bulk transport. Barges move 60% more cargo per gallon than trucks while producing fewer emissions. Rail lines handle longer hauls, while trucks complete last-mile deliveries.
| Transport Type | Cost per Ton | Typical Capacity | Weather Sensitivity |
|---|---|---|---|
| Inland Barges | $0.02-$0.05 | 1,500-3,000 tons | High (water levels) |
| Freight Rail | $0.03-$0.07 | 100-110 carriages | Moderate (snow/ice) |
| Semi-Trucks | $0.12-$0.20 | 25-30 tons | Low (road closures) |
When floods disrupt river traffic, grain piles up at storage facilities. This domino effect causes price swings that impact global buyers. Recent droughts lowered Mississippi water levels by 6 feet, cutting barge capacity 25%.
Impact of Weather Extremes on Crop Transportation
Extreme conditions create logistical nightmares for moving harvests. Sudden storms or prolonged floods force transporters to scramble for alternatives, often at steep costs. These disruptions don’t just delay shipments—they reshape entire supply chains.
When Water Becomes the Enemy
Flash floods top the list of high-stakes challenges. They collapse bridges within hours and drown rail lines, stranding shipments. One study found detours after major floods add $18–$32 per ton in fuel and labor costs. Storage facilities overflow when trucks can’t reach them, creating bottlenecks that last weeks.
Cold Snap Complications
Winter freezes bring different risks. Iced roads cause truck accidents, while frozen rivers halt barge traffic entirely. Last year, a single ice storm shut down Mississippi River operations for 11 days, delaying 1.2 million tons of grain.
| Event Type | Common Disruptions | Average Duration | Cost Impact |
|---|---|---|---|
| Flash Floods | Bridge failures, rail washouts | 3-14 days | +22% basis spread |
| Winter Storms | Road closures, frozen ports | 5-21 days | +15% storage fees |
Adapting to these patterns requires flexibility. Many operators now use real-time weather apps to reroute trucks before storms hit. Seasonal weight limits also play a role—lighter loads help trucks navigate slippery roads faster.
Climate shifts are rewriting the rules. With extreme events predicted to double by 2040, proactive planning isn’t optional—it’s survival.
Evaluating Transportation Infrastructure Vulnerabilities
America’s agricultural lifelines depend on systems built decades ago. Today, heavy rains and heat waves test their limits. A 2023 study found 40% of Midwest bridges weren’t designed for current precipitation levels.
Three critical weak spots stand out:
- Aging river locks that jam during flash floods
- Railroad corridors in floodplains
- Overpasses with outdated wind resistance ratings
These pinch points create ripple effects. When a key bridge closes, trucks detour through towns lacking weight-rated roads. Delays stack up fast—one collapsed overpass in 2022 stranded $47 million worth of grain.
| Infrastructure Type | Top Weather Threat | Economic Impact | Adaptation Cost |
|---|---|---|---|
| Inland Waterways | Droughts | $81M/day during shutdowns | $4.2B (10-year estimate) |
| Rail Networks | Extreme Heat | 15% speed reductions | $1.8B track upgrades |
| Highway Systems | Flash Floods | 32% rerouting costs | $600M/year repairs |
Operational headaches multiply during storms. Truckers face slower speeds to prevent rollovers. Barges sit idle when rivers run too high or low. “We’re constantly recalculating routes now,” shares Iowa-based logistics manager Tara Wells.
Future projects must balance today’s needs with tomorrow’s risks. Engineers now use climate models to design stronger overpasses. But funding gaps persist—the United States currently spends $5 billion less annually than needed on rural infrastructure.
These challenges affect everyone. Longer transport times mean higher grocery bills. They also threaten America’s role as a reliable global food supplier. Smart upgrades today could prevent costly crises tomorrow.
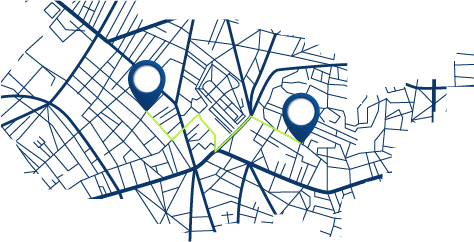
Analyzing Hypothetical Least-Cost Routes and Disaster Constraints
Modern mapping tools are rewriting how America moves its harvests. By crunching millions of data points, planners pinpoint the most efficient paths while preparing for unexpected hurdles. This approach balances cost savings with resilience—a critical combo in today’s shifting landscape.
Smart Mapping Meets Cost Efficiency
Geographic Information Systems (GIS) act like digital chessboards for crop transport. They weigh variables like fuel prices and cargo weight to recommend optimal paths. Waterways dominate these calculations—moving grain by river costs just $0.00001 per mile, making them 10,000x cheaper than trucks for bulk shipments.
| Transport Mode | Cost Per Mile | Typical Load | Flexibility |
|---|---|---|---|
| River Barges | $0.00001 | 2,500 tons | Low |
| Freight Trains | $0.001 | 100 cars | Medium |
| Semi-Trucks | $0.10 | 25 tons | High |
Disaster-Proofing Delivery Paths
When floods or storms strike, algorithms instantly map detours around trouble zones. A 2023 simulation showed rerouted shipments after Midwest floods added 18% to costs but kept goods moving. Real-time weather feeds help teams predict delays before trucks roll out.
Consider these adaptive strategies:
- Automated county-level blockage alerts
- Hybrid routes combining rail and short-haul trucks
- Emergency storage partnerships near major ports
| Disaster Type | Avg. Detour Miles | Cost Increase | Recovery Time |
|---|---|---|---|
| Floods | +84 | 22% | 9 days |
| Ice Storms | +127 | 31% | 14 days |
“It’s not about avoiding disasters anymore,” notes a Chicago logistics director. “We design networks that bend but don’t break.” This mindset helps explain why some regions rebound faster despite harsh climate change effects.
Assessing the Role of Climate Conditions on Corn and Soybean Yields
Farmers know that a few degrees can mean the difference between bumper crops and lost income. Corn’s growth cycle proves particularly vulnerable during pollination—a critical phase where temperatures above 95°F slash pollen production. When thermometers linger above 86°F, plants struggle with water absorption and sunlight conversion, shrinking kernel development.
Soybeans face different challenges. These legumes thrive between 77-86°F but suffer when heat strikes during flowering. Elevated temperatures trigger flower loss and fewer pods, directly cutting harvest volumes. “It’s like watching money evaporate,” shares Nebraska grower Mark Thompson. “One hot week can undo months of work.”
Successful cultivation now requires balancing two factors: temperature spikes and moisture availability. Plants demand extra water during heatwaves to cool themselves, creating complex management puzzles. Dry spells compound stress, while heavy rains can drown roots.
| Crop | Critical Phase | Temperature Threshold | Yield Impact |
|---|---|---|---|
| Corn | Pollination | 95°F | 45% reduction |
| Soybean | Flowering | 86°F | 30% loss |
Understanding these thresholds helps explain recent yield fluctuations across key states. As climate patterns shift, producers must adapt planting schedules and irrigation strategies to protect their livelihoods—and our food supply.
Exploring the Effects of El Niño, La Niña, and Global Climate Phenomena
The Pacific Ocean holds surprising sway over Midwest harvests and supply chains. Two climate patterns—El Niño and La Niña—act as planetary thermostat switches, altering rainfall and heat distribution worldwide. Their effects reach deep into America’s agricultural core, shaping everything from planting dates to trucking schedules.
Ocean Currents, Local Consequences
Warmer temperatures in the equatorial Pacific during El Niño typically bring milder winters and variable spring rains to the Midwest. This can accelerate crop growth but raises drought risks during summer months. The 2024 forecast shows a rapid shift, with a 65% chance of La Niña emerging by July—right as corn enters pollination.
| Pattern | Midwest Impact | 2024 Probability | Key Risks |
|---|---|---|---|
| El Niño | Early warmth, uneven rains | Jan-Jun: 85% | Soil moisture deficit |
| La Niña | Cooler summers, storm clusters | Jul-Dec: 65% | Harvest delays |
These transitions matter beyond fields. Transport planners track climate models to anticipate road closures and river levels. “A late-season pattern flip forces us to rethink storage and shipping timelines,” explains an Iowa logistics coordinator.
Global food markets feel the ripple effects. When La Niña strengthens, it often reduces South American soybean yields—increasing demand for U.S. stocks. Adaptive strategies like staggered planting help farmers hedge against unpredictable weather patterns.
Understanding these connections isn’t just academic. It’s becoming essential for maintaining stable prices and reliable deliveries in our changing climate.
Investigating Crop Production Challenges in the Corn Belt
Growing America’s staple crops now demands split-second decisions. Farmers face a delicate balancing act—too much rain drowns roots, while drought starves plants. Between the V5 and V14 growth stages, corn plants decide their kernel count, making this critical window the make-or-break phase for harvest success.
Late planting adds another layer of risk. Crops that miss spring’s ideal conditions gamble on flawless summer weather. One Iowa study showed delayed fields needed 18% more rainfall to hit average yields. Early-season downpours compound these struggles, compacting soil and delaying fieldwork for weeks.
Adaptation strategies are evolving. Some growers now use drought-resistant hybrids, while others stagger planting dates. Yet unpredictable patterns test even the best plans. “We’re constantly recalculating,” shares a Nebraska agronomist. “Last year’s solution might not work tomorrow.”
These hurdles ripple beyond fields. Delayed harvests strain storage systems and transportation timelines, affecting global markets. Solving today’s production challenges requires equal parts innovation and resilience—keys to keeping dinner tables stocked nationwide.